Why Choose CloudMetrix?
Cloud costs are complex. FinOps teams are overwhelmed.
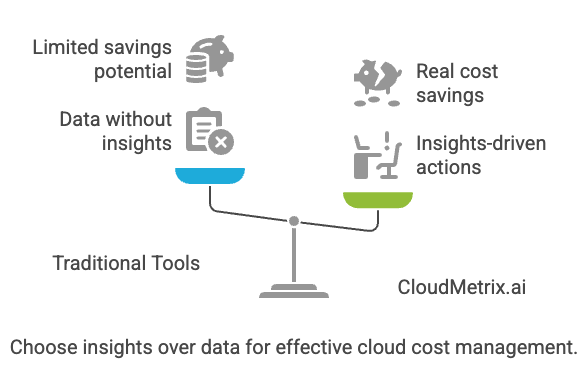
Traditional tools give you numbers, not insights, actions, or real savings.
Managing cloud spend shouldn't be a guessing game.
CloudMetrix empowers FinOps teams with real-time visibility, intelligent automation, and actionable savings — built for today's scale and speed.
Why Leading FinOps Teams Choose CloudMetrix
Unlock faster savings, deeper insights, and seamless collaboration, all purpose-built for modern cloud operations.

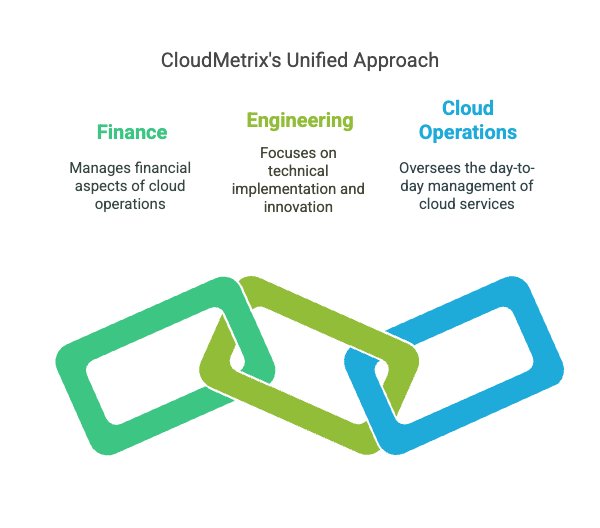
Deep FinOps Alignment
Purpose-built for FinOps best practices, not retrofitted monitoring tools. We bridge Finance, Engineering, and Cloud Operations with a unified view everyone can act on.
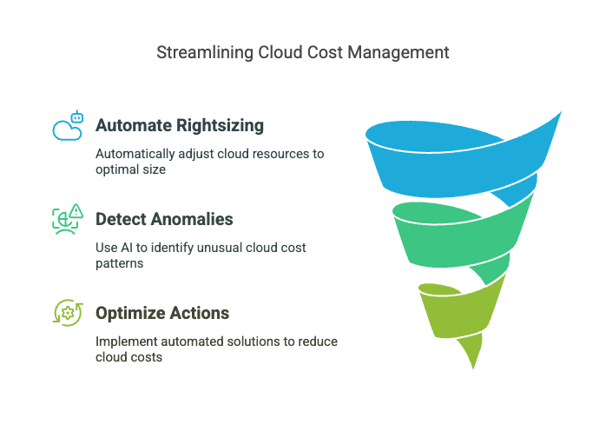
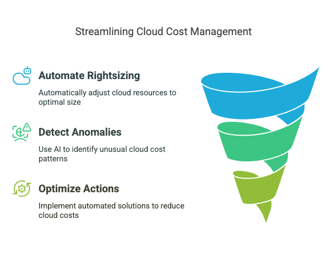
AI-Driven Automation at Scale
Automate rightsizing, anomaly detection, and optimisation actions. Reduce manual effort by over 90% and let your team focus on innovation, not firefighting cloud costs.

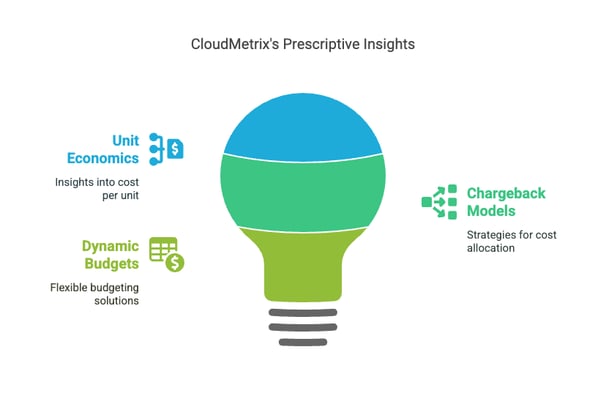
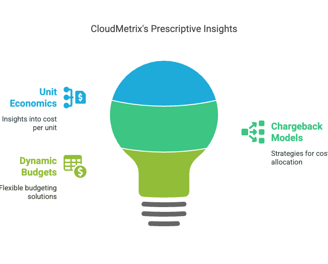
Actionable Insights, Not Just Dashboards
Beyond charts and graphs, get prescriptive recommendations tied directly to business outcomes, including unit economics, chargeback models, and dynamic budgets.
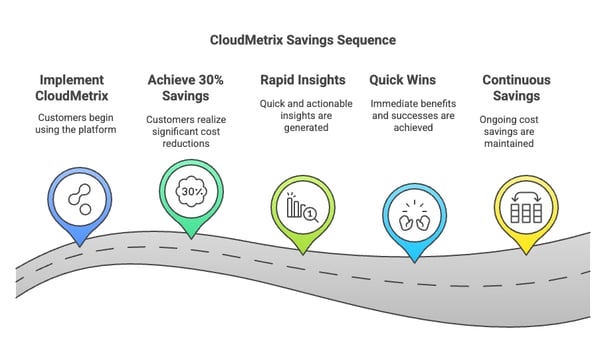

Fast, Measurable ROI
Customers achieve 30% savings within the first 60 days with CloudMetrix. Our platform delivers rapid insights, quick wins, and continuous savings you can measure.
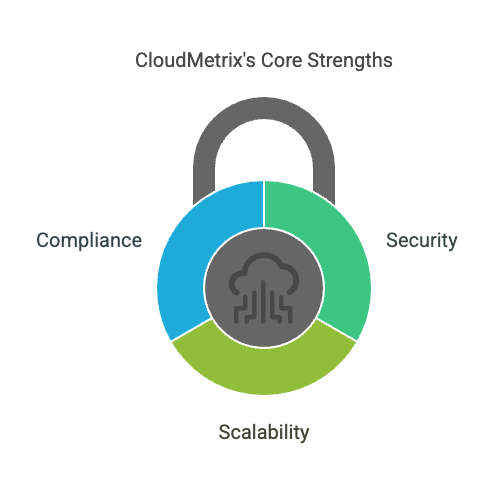
Enterprise-Ready, Team-Friendly
Security, scalability, and compliance are built into everything we offer. Whether you're managing $50K or $50M in cloud spend, CloudMetrix grows with you seamlessly.

CloudMetrix transformed our cloud expenses, optimizing costs and enhancing our operational efficiency significantly.
John Doe

Thanks to CloudMetrix, our cloud costs are lower, and our processes are running much more efficiently.
Jane Smith
